The Importance of FortiGate Session Table Flags in Network Troubleshooting
When troubleshooting network issues, it is often useful to review the session information on your FortiGate firewall to gain insight into what is happening on your network. For example, if you are experiencing issues with web traffic, you can review the session information for a web session to see if there are any problems with the connection.
When you view the session information on your FortiGate firewall, you may notice several flags associated with each session. These flags can provide useful information about the state of the session and can be used to troubleshoot network issues. This blog post will provide detailed information on the various flags.
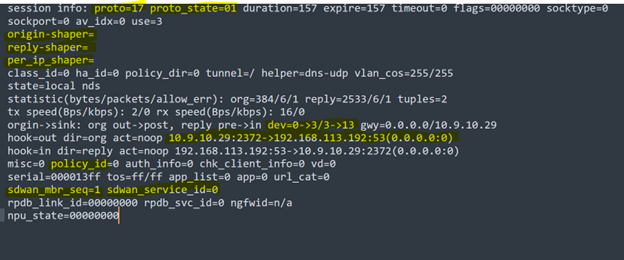
proto
These protocol numbers are used to identify the protocol being used in network traffic.Here are some common protocol numbers used in networking:
- TCP: 6
- UDP: 17
- ICMP: 1
- GRE: 47
- ESP: 50
- AH: 51
- IP: 4
proto_state
On FortiGate, “proto-state” on a session refers to the current state of the connection for that particular session.
When a new session is initiated, the FortiGate creates a session entry that includes information such as the source and destination IP addresses, ports, and the current state of the connection. As the session progresses, the state of the connection may change, and the FortiGate updates the session entry to reflect the new state
The different states that a session can go through include:
NEW : This state indicates that the session is new and has not yet been established.
ESTABLISHED : This state indicates that the session has been established and is currently active.
FIN-WAIT : This state indicates that the session is in the process of being terminated, with the client sending a FIN (finish) packet to the server.
CLOSE-WAIT : This state indicates that the session is in the process of being terminated, with the server sending a FIN packet to the client.
TIME-WAIT This state indicates that the session has been terminated, but the FortiGate is waiting for any remaining packets to arrive before closing the session.
Please refer to the knowledge base (KB) article below to review the specifications of each number
Shapers
When traffic passes through a shaper, the FortiGate creates a session entry that includes information about the shaper applied to the traffic. This information can include the name of the shaper, the bandwidth limits set by the shaper, and the status of the shaper. In the listed session no shapers is applied.
Source and Destination
From this flag, we can see the source and destination in the session session.
hook=out dir=org act=noop 10.9.10.29:2372->192.168.113.192:53(0.0.0.0:0)
A session has been initiated by the source IP address 10.9.10.29 with source port 2372, attempting to reach the IP address 192.168.113.192 on port 53
Reply:
hook=in dir=reply act=noop 192.168.113.192:53->10.9.10.29:2372(0.0.0.0:0)
policy_id
In this case, you can determine which policy ID a session is hitting, and in this instance, it is 0, indicating that the session is local.
sdwan_member
This flag indicates which SDWAN member device is being used to send out traffic. In this example, sdwan_mbr_seq=1 shows that it is using port1.
To view SDWAN members:
# di sys  sdwan member
Member(1): interface: port1, gateway: x.x.x.x, priority: 0, weight: 0
Member(2): interface: port2, gateway: x.x.x.x, priority: 0, weight: 0
sdwan_service_id
The SDWAN_service_id specifies which SDWAN rule the session is hitting. In this case, SDWAN_service_id=0 which states that it is using implicit SDWAN rule.


